Docs · 🚀 Getting Started
Dashboard tour: what's where?
A one-line map of every page in the left menu.
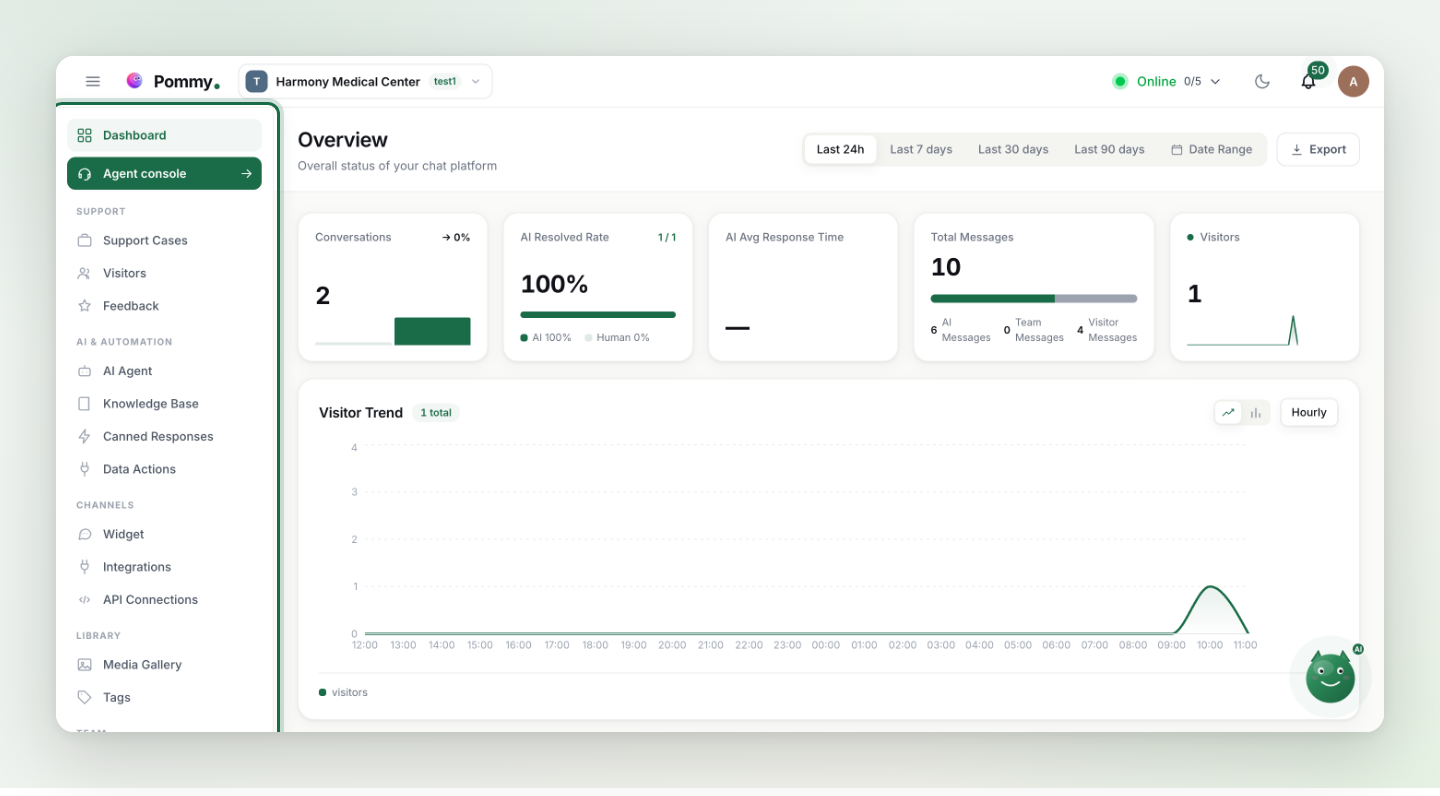
When you sign in, the left menu is your command center. The table below tells you what each page is for.
Daily work#
| Menu | What it's for |
|---|---|
| Dashboard | Overview: conversation counts and summary charts. |
| Agent console | The live-support screen — watch, take over and answer conversations. |
| Support Cases | Support tickets: a record of work that needs follow-up. |
| Visitors | Visitors on your site and their past conversations. |
| Feedback | Ratings and comments your customers leave. |
Content and AI#
| Menu | What it's for |
|---|---|
| AI Agent | Assistant settings: on/off, language, handover, booking. |
| Journeys | Walkthroughs the assistant performs on your own site — switched on per project by us. |
| Coding Agents | Connect your coding agent (Claude Code, Codex, Cursor…) to Pommy over MCP. |
| Knowledge Base | Documents, FAQs and help articles — plus website import and the showcase. |
| Canned Responses | Ready-made reply templates for your team. |
| Data Actions | Your own API endpoints, turned into tools the assistant can call. |
| Media Gallery | Images and files you've uploaded. |
Setup and administration#
| Menu | What it's for |
|---|---|
| Widget | The chat bubble's appearance and the install code. |
| Website | The domains your widget is allowed to run on, and their verification. |
| Integrations | Your store (Shopify, WooCommerce, ikas), Google Calendar, WhatsApp, Telegram and the rest. |
| API Connections | MCP servers — external tools your assistant can use. |
| Team | Team members and invites. |
| Roles & Permissions | Who can access what. |
| Tags | Label and organize conversations. |
| Audit Logs | A record of who changed what in the dashboard. |
| Reports | Team performance over a date range, with export. |
| Plan & Billing | Subscription and invoices. |
| Settings | Project settings. |
Tip: The search box above the menu searches page names — the moment you wonder "where was that setting?", type it there.